Showing posts with label development. Show all posts

2008-09-02

AVM Microformat Generator for GNU emacs

Now that Stuart has blogged about the AVM microformat generator I thought it time to upload a little hack I did for GNU emacs when he first pointed me at the generation tool he'd written.

The tool is called avmmf.el (download it here) and it adds a command to GNU emacs (avmmf-insert) which prompts you for an object, talks to the AVMMF generator, gets the resulting code and pastes it into the current buffer. I'm thinking it might be handy if you're writing some (X)HTML by hand.

2008-03-14

Google Sky Map is Here

Yay! Finally! Google Sky Map is here!

I've had a quick 5min play and so far so good.

I really must pull my finger out and go and have a play with the API and see how I could possibly use it on my own site.

Edit: There's a Google blog entry discussing the history of the project and, of course, a YouTube video:

2008-02-01

Astronomy Blogs Timeline

This is cool (he says, catching up with something a few days old):

Stuart, over at Astronomy Blog, has use SIMILE's timeline code to produce a timeline of astronomy blogs

2007-12-20

In Support of UK Astronomy on Facebook

I'll admit here and now that I know nothing about developing Facebook applications so this is a very quick hack with no bells or whistles.

However, I was thinking it might be nice to have a Save Astronomy "badge" on my Facebook profile, so I quickly knocked up something to do the job. It ends up looking like this:


It's quick, it's dirty, but it works.

If you're on Facebook please considering adding this application to your profile.

2007-12-14

Google Sky Map on the Way?

Via Ogle Earth:

Sky Maps coming soon: Being finalized in the Google Maps API Group: Google Sky’s data accessible via the Maps API, ready for embedding in your website.
That's great news (see the demo over here), this is the sort of thing I was hoping would turn up at some point. Google Sky is great and all but the ability to create applications on your own website that make use of their sky map... That could be very interesting.

2007-09-07

LovellCam for iGoogle

Sort of following on from Astronomy on Your Google Homepage and More Astronomy on Your Google Homepage, how about a Lovell Telescope Camera on your Google Homepage (although, these days, it's called iGoogle):


If you use iGoogle and want to give it a spin just add this to your home page.

2007-09-04

A plan for more openness

I like where Stuart is going with this.

2007-08-24

SIMBAD, ruby, and a little bit of hacking

Caution: Contains geekness

Following Al's suggestion in a comment yesterday, I decided to take a look at the name resolver web service. Never having worked with this sort of stuff before it took a little bit of reading (even more so since perl and me fell out a long time ago so I tend to use ruby when messing about with script-like stuff) but I finally got something up and running.

I've knocked together a very simply test script called aresolve. The only point of it is to take a name of something on the command line and print some information about it (in this case the RA/Dec and all aliases).

And it works:

davep@hagbard:~/temp$ ./aresolve M45
RA...: 56.8500000
Dec..: +24.1166667
Alias: M 45
Alias: C 0344+239
Alias: Cl Melotte 22
Alias: H 0346+24
Alias: [KPR2004b] 47
Alias: NAME PLEIADES
Alias: NAME SEVEN SISTERS
Alias: OCl 421.0


Sweet!

Yes, I know, to those who do this sort of stuff every day it's probably no big deal but, well, you know, when you try something yourself for the first time...

So, thanks to Al, I've got a solution. Now to go find a problem...

2007-04-27

Randomness

I just had a rather silly idea, and it took no time to implement.

I was thinking that I've got a lot of observing logs now and, to a large degree, I can generally find the one I want (often via the log index). But it might also be fun to have a facility that selects a random logs.

So that's what I did: view a random observing log.

2007-01-24

Logs by comet

Now that I've observed a handful of comets I've got around to adding another way of getting at my logs: by comet.

There aren't that many there at the moment. Let's hope this situation improves this year.

2006-11-30

Daylight graphs

I've updated the my sky section of my main site to include a couple of daylight graphs. The first one graphs the rise and set positions of the Sun for the current day:


The second graphs sunrise/sunset times and total hours daylight for my location:


And the reason I added them? Well, no good reason really. They are sort of useful for a quick glance but the main reason I added them is because I fancied a quick bit of hacking (and also because I've been playing with compass-a-like graphs on my weather station site).

2006-11-22

A bit more documentation

Given that last weekend's sessions introduced a new type of observing to my logs I felt the need to add a new markup item to my logging system. While doing that I realised that I had no definitive list of all the forms of markup that could be used in the notes for a session or an observation.

So, this morning, I created the list in the (still incomplete) documentation for the file format I use. I've also created a page for each type of markup; each page gives a brief description of the purpose of the markup, the syntax of the markup and also gives an example or two of the markup in use.

I'm glad I finally got around to doing this. From now on I won't need to go looking at my source code or old logs to remind myself how a specific markup item works.

2006-11-21

More time stats

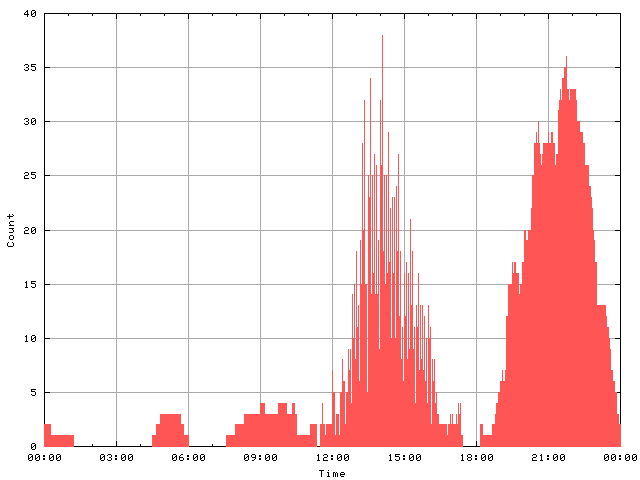
After adding the time stats to my stats page earlier to day I realised that I now had most of the tools in place to figure out which part of the day was most "popular" in my logs. I decided that it called for a nice little graph:


From this I deduce I'm not the sort of person who likes to observe during the early hours of the morning. ;)

Time stats

This morning I made a quick addition to the code that manages my observing logs and added some code that extracts the elapsed times for all my sessions. Using this I've been able to add a new section to my stats page that lists some time-based values.

As of now, since 2005-04-16, I've spent 93 hours doing something related to observing. On average I've spent about ½ hour per session. My shortest session is 1 minute long and my longest is 252 minutes long (although the the longest session is a little misleading because there was a break of about 1 hour during it).